When I interviewed at Salesforce for a sales engineer position, the recruiter mentioned that I would have to do a panel presentation to see how well I could handle the role. To say I was scared was a big understatement. I usually work behind the scenes on all my projects but I loved the Salesforce analytics platform (not Tableau) – but Wave Analytics, Einstein Analytics, Tableau CRM, CRM Analytics.
I was supposed to get a use case to prepare for the interview, but there was a misunderstanding. So, I decided to use a project that I worked on at my current job. The project involved combining the data from two (2) Salesforce orgs and creating a dashboard (with security) to show the health of the business and display some trending between the different LOBs.
Step 1: Understand Your Data
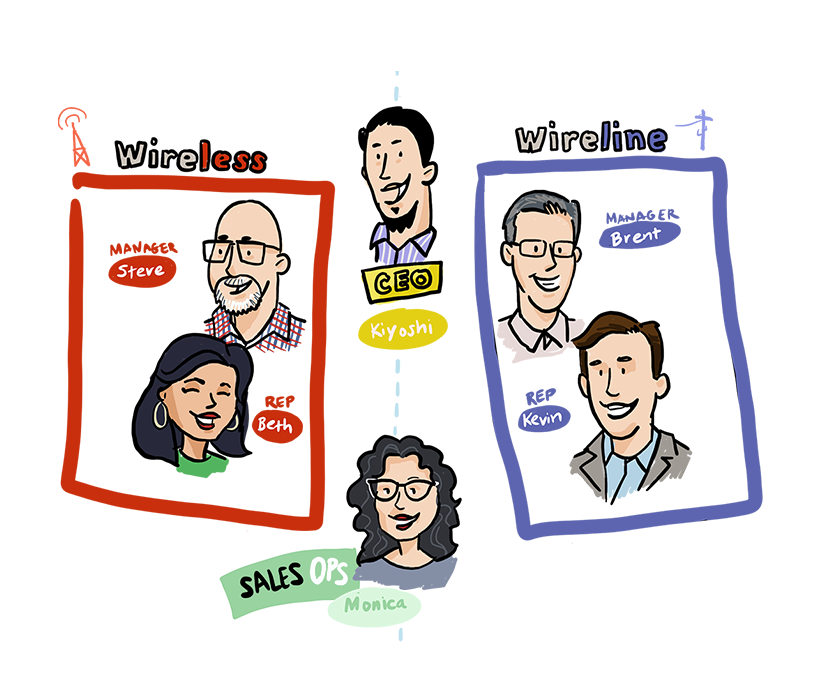
The first step in creating a multi-org dashboard is to understand the data you have. For this example, we will be using telecom data from two different Salesforce orgs: one for wireless and one for wireline. Each line of business had its own way of doing things, so trying to think of a way to present the data in a useful way that was understandable to the end user was hard.
Step 2: Identify Key Metrics
The next step is to identify the key metrics that will be displayed on the dashboard. This could include metrics such as churn rate, lines of service, revenue per customer, or customer lifetime value. By identifying these key metrics, I could start to plan for on how the data will be presented on the dashboard.
Step 3: Get the Data and Create the Dashboard
Once we have identified the key metrics and understand the data needed, I had to figure a way to get the data into one place and clean/shape the data for consumption. Before CRMA had a multi-org template to use, I had to leverage its native external connector. Once I set up the data syncs and objects, I created a dataflow to pull in the data to create the datasets that I would need. I would have to create another dataflow for the other org, so the dashboard could exist in the other org. Remember, not every user would have access to the other org.
Step 4: Add security
To make the dashboard secure and use row level security (meaning users could only see the data that they were meant to see), I had to think of a way to implement using a common data attribute that the company shared between both orgs: company id. Once I realized that this id could be used, I used the flatten transformation to create the hierarchy needed using company ids instead of the usual Salesforce role ids. After the transformations was completed and the datasets registered, I was able to add a security predicate utilizing my company id solution.
Step 5: Test and Refine
Once the dashboard was created, it was important to test it to make sure it was working and secure. This was done by end users who worked in both orgs and handled both wireline and wireless businesses. Based on the initial feedback received, I was able to refine the dashboard and make it even more effective. Folks didn’t have to go to two orgs and run Lightning reports separately and merge them together to get the full picture.
Conclusion
In conclusion, creating a multi-org dashboard using CRM Analytics for a multi-org use case provided to be an actual working scenario that was well received by upper management. But even better, I was offered the job at Salesforce using this project.
Article also posted on our other site that specializes in CRM Analytics (pronounced “NLX”), https://www.crmnlx.com/